AI Sales Forecasting: How It Works, With a Live Demo

Ask three people in most companies what next quarter’s revenue will be and you will get three numbers, all of them single numbers, none of them with a stated confidence level, and at least one of them adjusted upward because of what the board wants to hear.
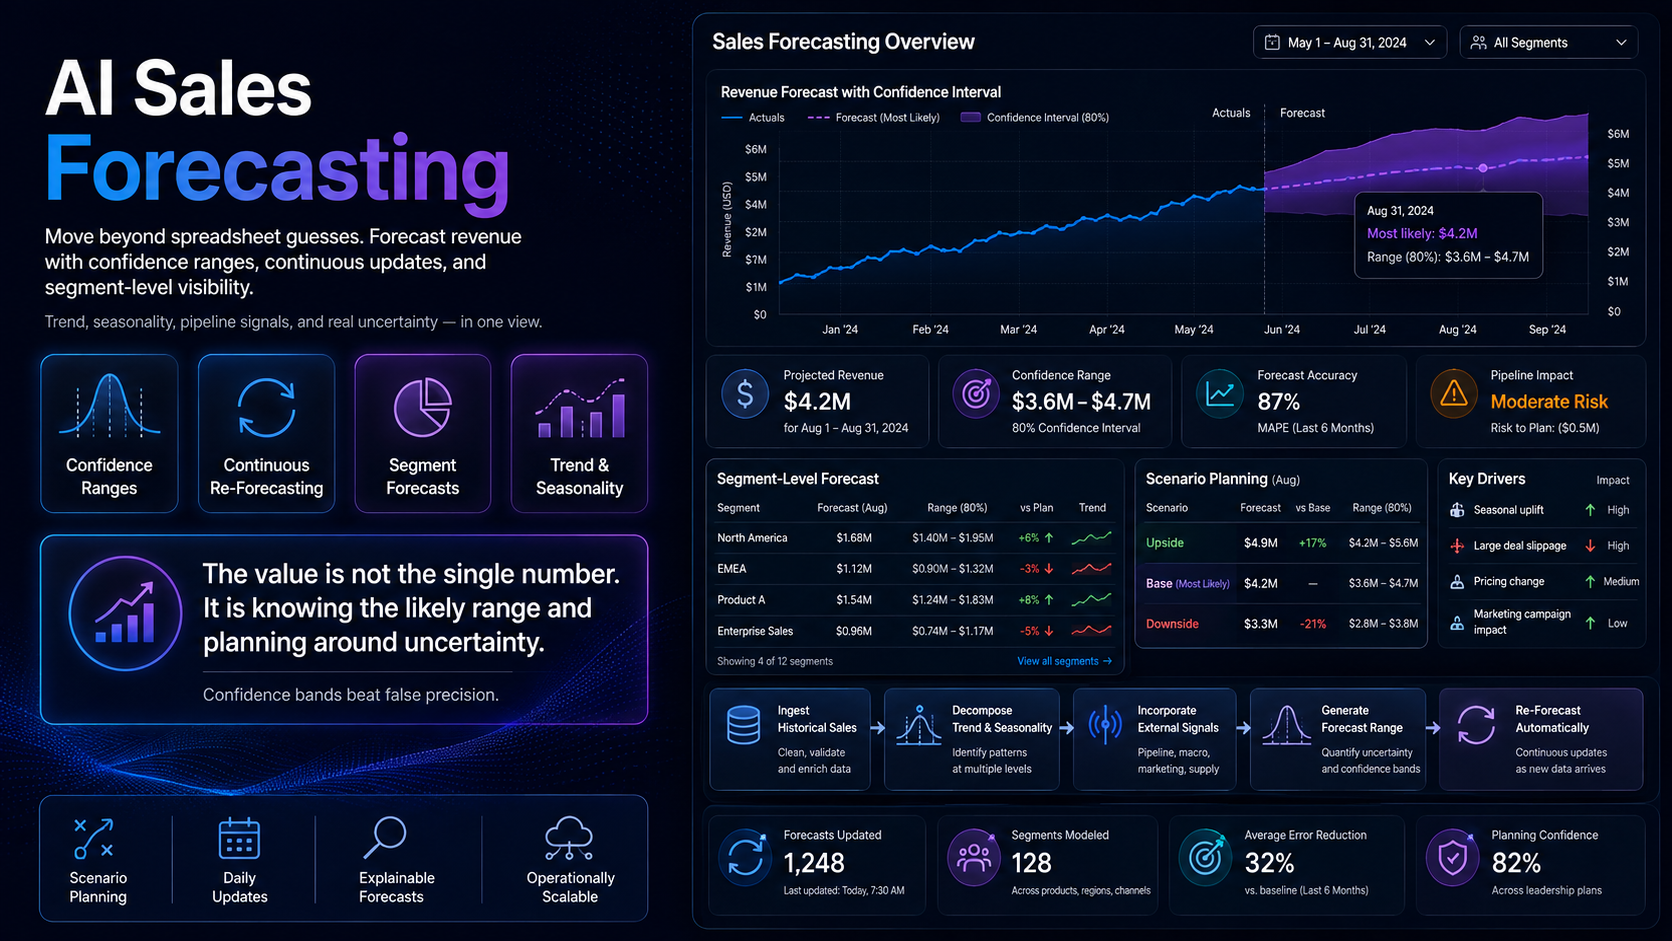
The problem with sales forecasting is rarely arithmetic. It is that the output format encourages false precision. A forecast of 4.2 million sounds authoritative in a way that “somewhere between 3.6 and 4.7 million, most likely around 4.2” does not, even though the second version is the honest one and the more useful one for planning.
This article covers how AI sales forecasting works, why confidence ranges matter more than point estimates, and where these models go wrong.
Watch the demo
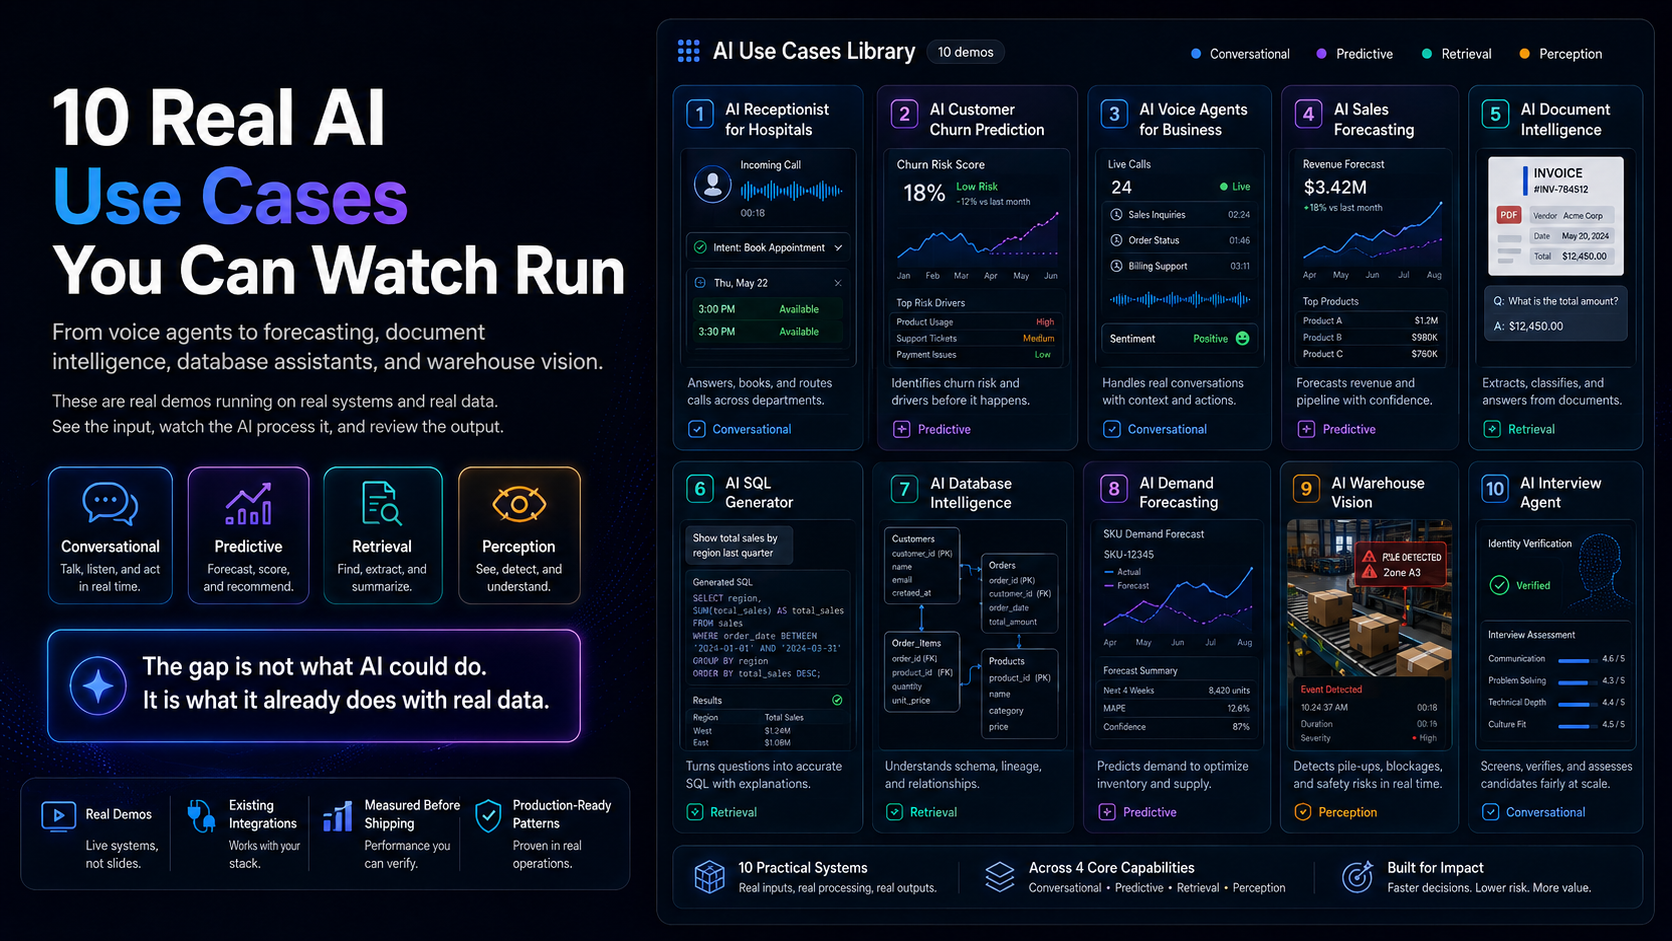
The demo shows historical sales data producing continuously updated forecasts rather than a figure assembled once at the start of a quarter, with the projection re-running as new data arrives.
Why spreadsheet forecasts drift
The typical process looks like this. At the start of the quarter, someone builds a model in a spreadsheet using last year’s numbers, the current pipeline, and a growth assumption. It is careful work. By week three, a large deal slips, a seasonal pattern lands early, or a competitor changes price. The spreadsheet cannot react without someone rebuilding it, so it quietly becomes fiction that everyone still references.
The failure is not the analyst. It is that a manual model updates at the speed a human can rebuild it, while reality updates continuously. Three structural problems follow.
Recency bias. Manual forecasts overweight whatever happened most recently, because that is what is front of mind.
Optimism pressure. Forecasts that pass through people with targets tend to drift toward what those people hope will happen.
Invisible seasonality. Human forecasters catch the obvious cycles and miss the subtle ones, particularly patterns that operate on multi-year or overlapping cadences.
How AI sales forecasting works
1. Learn from history
The model ingests historical sales at whatever granularity you have, ideally by product, region, and channel rather than just a company total. Disaggregated data is substantially more useful, because patterns that cancel out in aggregate remain visible at the segment level.
2. Decompose the signal
Good forecasting separates the underlying trend, recurring seasonality, and irregular events. Separating them matters because they behave differently. Trend continues, seasonality repeats, and one-off events should not be extrapolated. A model that treats a past supply disruption as a recurring pattern will produce confidently wrong numbers.
3. Incorporate external factors
Sales rarely depend only on past sales. Pricing changes, marketing spend, competitor activity, and macro indicators all contribute. The more of this you can supply, the better the model handles conditions that differ from history.
4. Produce a range, not a point
This is the part that changes decision quality. Rather than one number, a well-built forecast produces a most likely value with a confidence interval. That lets you plan differently for the downside than for the upside, and it makes the model’s uncertainty explicit rather than hidden.
5. Re-forecast continuously
Each time new data arrives, the projection updates. The forecast stays current because it maintains itself, which removes the drift problem entirely.
What data you need
The practical minimum is two to three years of historical sales at a useful granularity, with dates and amounts. Two years lets the model see seasonality twice, which is roughly what it needs to distinguish a pattern from a coincidence.
Beyond that, pipeline data, pricing history, and marketing spend all improve accuracy. But the biggest determinant of forecast quality is usually data hygiene rather than data volume. Inconsistent product categorisation, deals recorded against the wrong period, and revenue recognised at varying points in the process do more damage than a shorter history.
Where forecasting models go wrong
Structural breaks. Models learn from history and struggle when the future genuinely differs from the past. A new market, a major pricing change, or an unprecedented external shock will break a forecast. The model does not know it is in new territory. You do, and you have to say so.
Confidence intervals get ignored. Teams often extract the central number and discard the range, which throws away the most valuable output. If your planning process only accepts a single number, the model’s honesty about uncertainty is wasted.
Aggregation hides problems. A company-level forecast can look accurate while every underlying segment is badly wrong, with errors cancelling out. Evaluate accuracy at the level you make decisions.
The forecast becomes a target. Once a forecast is used to set quotas, behaviour changes to hit it, which contaminates the data the next forecast learns from. Keep forecasting and target-setting conceptually separate.
Short histories overfit. With limited data, models find patterns that are noise. More history is genuinely better here, and there is no clever technique that substitutes for it.
What deployment looks like
Four to eight weeks.
Weeks 1 to 2. Assemble and clean historical data. This is almost always the longest phase. Agree the accuracy metric and the current baseline, because without knowing how wrong the spreadsheet is today, you cannot show improvement.
Week 3. Build the evaluation harness. Test the model against held-out historical periods, so you can measure how it would have performed on quarters you already know the answer to.
Weeks 4 to 6. Build, tune, and produce the dashboards and confidence ranges.
Weeks 7 to 8. Run in parallel with the existing process for one cycle. Do not switch off the spreadsheet until the model has been right on a real period.
That parallel run is the step that earns trust. Finance teams reasonably do not adopt a forecast they have not seen perform.
How to judge whether it is worth it
Start by measuring how wrong you are now. Take your last four quarterly forecasts and compare them to actuals. That error percentage, applied to the decisions the forecast drives, is the size of the prize.
The return comes from the decisions the forecast informs, not the forecast itself: inventory purchased, staff hired, capacity committed, cash planned. If your forecast error is modest and your decisions are not very sensitive to it, this may not be your priority. If you are regularly over or under by double digits and making large commitments on that basis, it usually is.
Our practical framework for measuring AI ROI covers how to quantify this, and why most AI projects stall explains the adoption problem that kills forecasting projects more often than accuracy does.
Related use cases
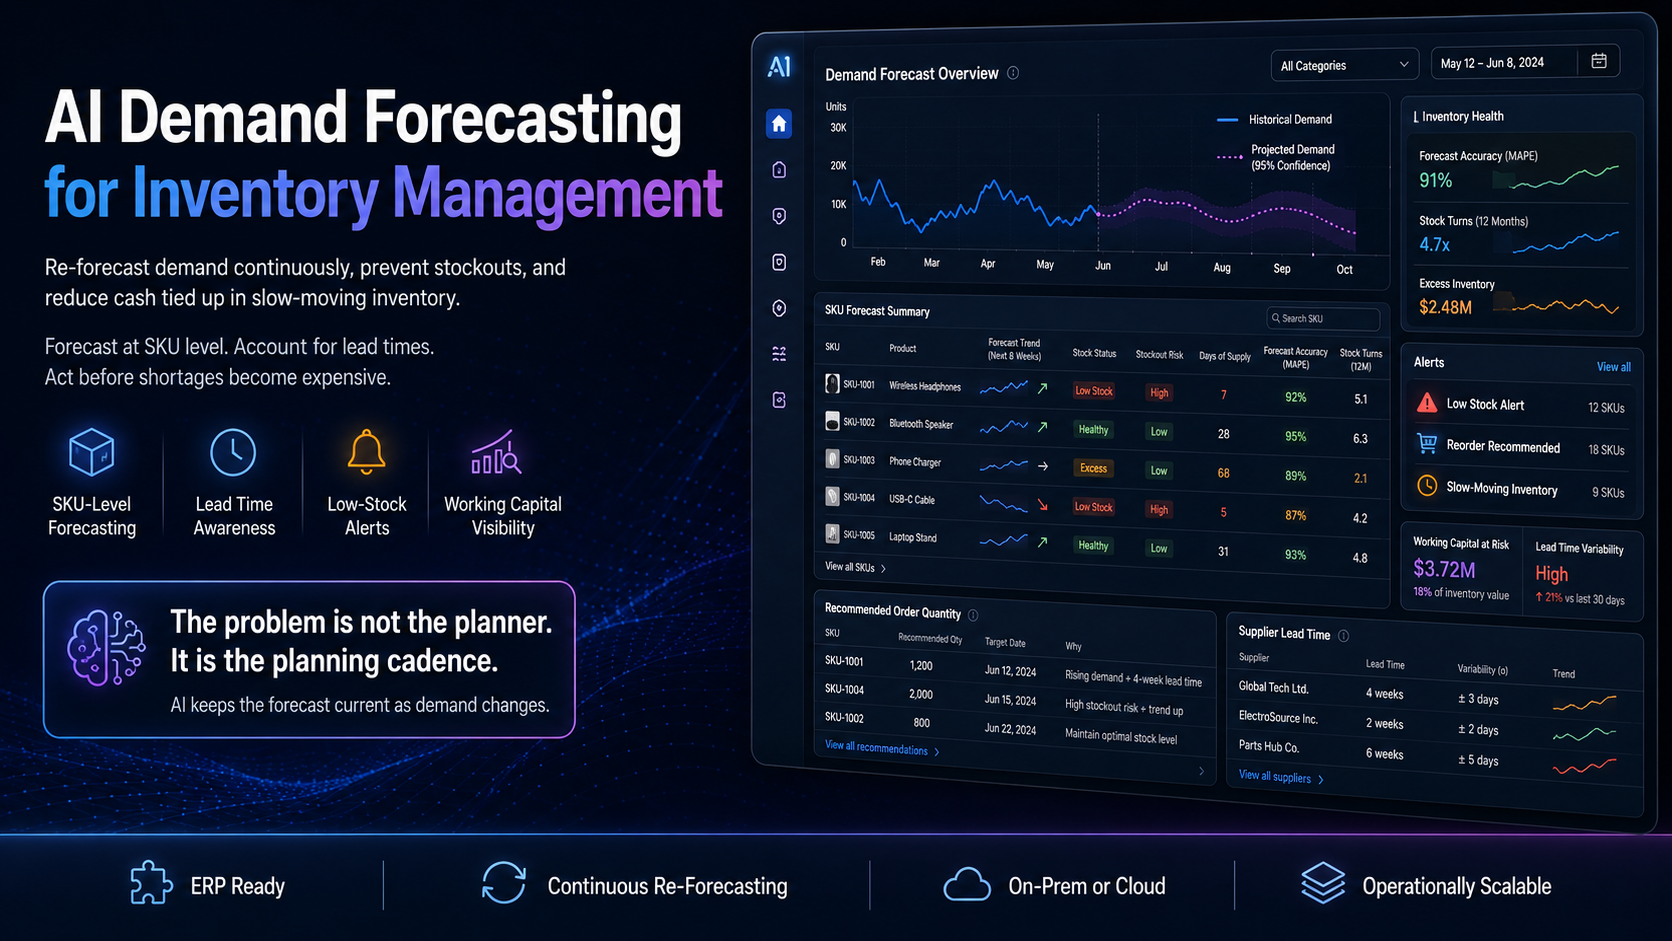
AI demand forecasting for inventory applies the same family of techniques to stock rather than revenue, and is often the higher-return sibling for businesses carrying physical inventory. AI churn prediction forecasts retention rather than acquisition.
Browse everything in our AI use cases library.
Frequently asked questions
How much history do we need?
Two to three years at minimum, so the model can observe seasonal patterns repeating. One year is usually not enough to separate pattern from noise.
How accurate will it be?
That depends on how predictable your business is. A stable subscription business forecasts far more accurately than a project business with lumpy large deals. The right question is not what accuracy is achievable in the abstract, but whether it beats your current process, which is measurable.
Does it replace our sales team’s judgement?
No. Reps know things that are not in the data, such as a champion leaving or a budget freeze. The best process combines a statistical baseline with human adjustment, where the adjustments are recorded so you can see whether they help.
How often does it update?
Continuously, or on whatever cadence suits your decisions. Daily is typical for operational use, weekly for planning.
What about new products with no history?
Forecasting genuinely new products is hard and the model will be uncertain, correctly. Analogous product history and early demand signals help, but honest wide ranges are better than false precision.
Can it forecast by region and product, not just total?
Yes, and it should. Segment-level forecasts are more useful and reveal errors that cancel out in the aggregate.
AINinza is the AI practice of Aeologic Technologies, backed by over a decade of enterprise engineering. If your forecast is rebuilt by hand each quarter, we are happy to talk through what continuous forecasting would look like on your data.