AI Demand Forecasting: How to Stop Losing Money on Inventory

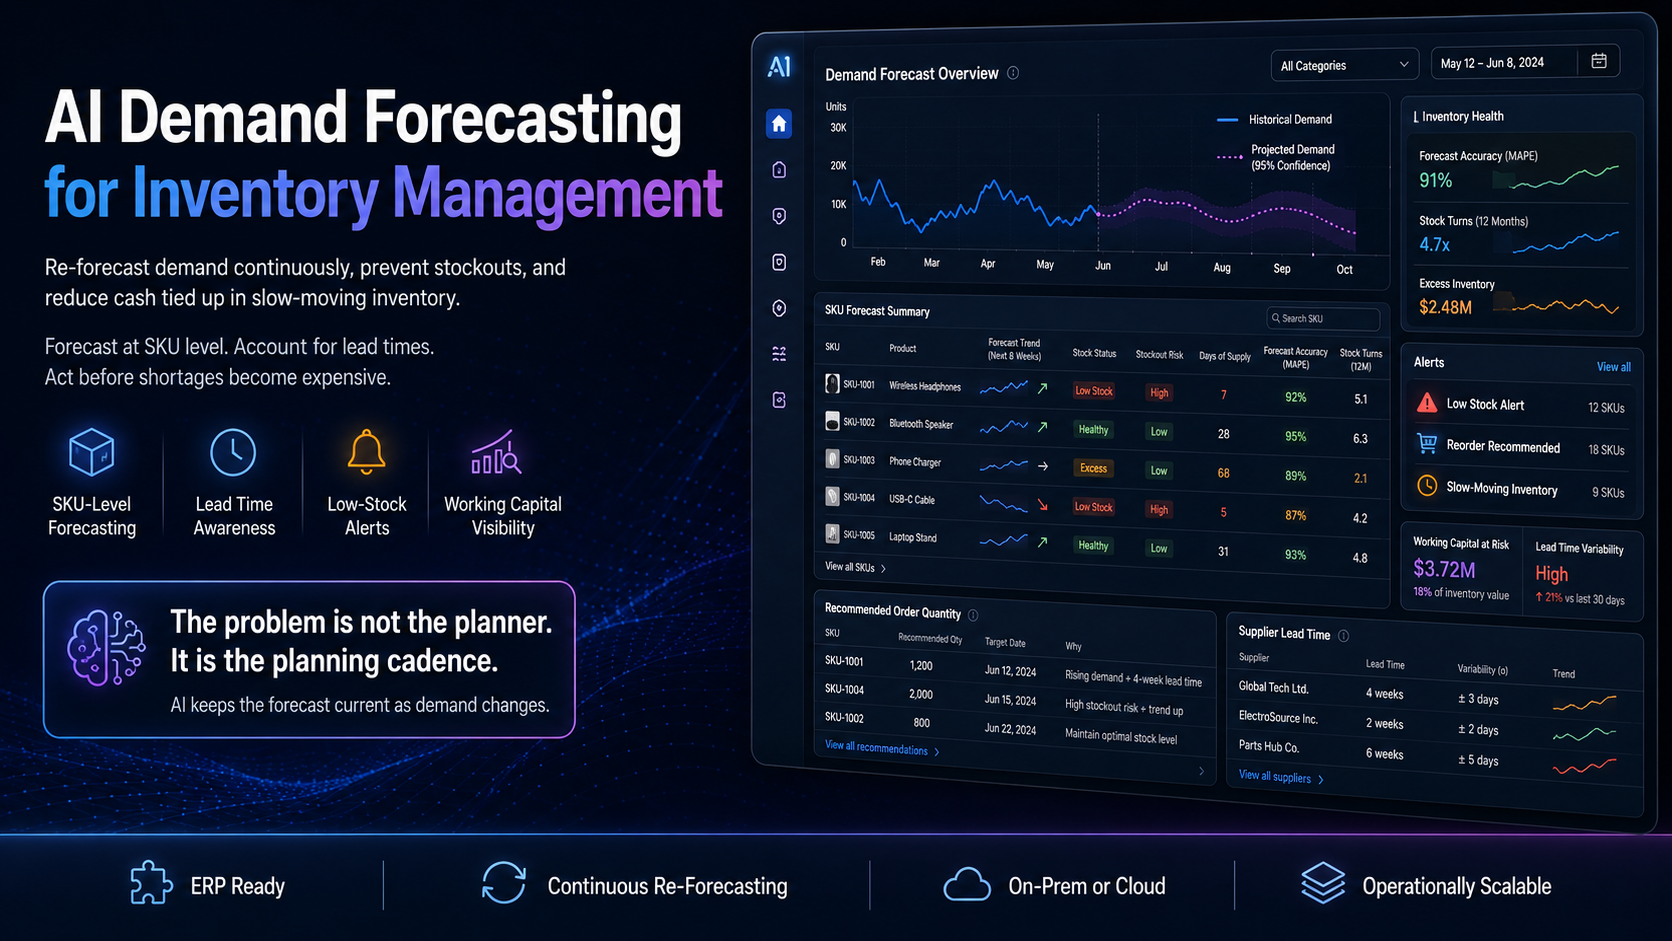
Inventory is where mid-sized manufacturers and distributors quietly lose the most money, and it almost never shows up as a line item called “inventory mistakes”.
It shows up as working capital tied up in stock that is not moving. As write-offs at the end of the year. As expedited shipping to cover a shortage. As a customer who ordered elsewhere because you did not have the item. Each of these has a different owner and a different explanation, which is precisely why the underlying cause goes unaddressed.
The underlying cause is usually the same. The demand plan is built once, in a spreadsheet, and reality moves faster than anyone can rebuild it. AI demand forecasting fixes the cadence rather than the people.
Watch the demo
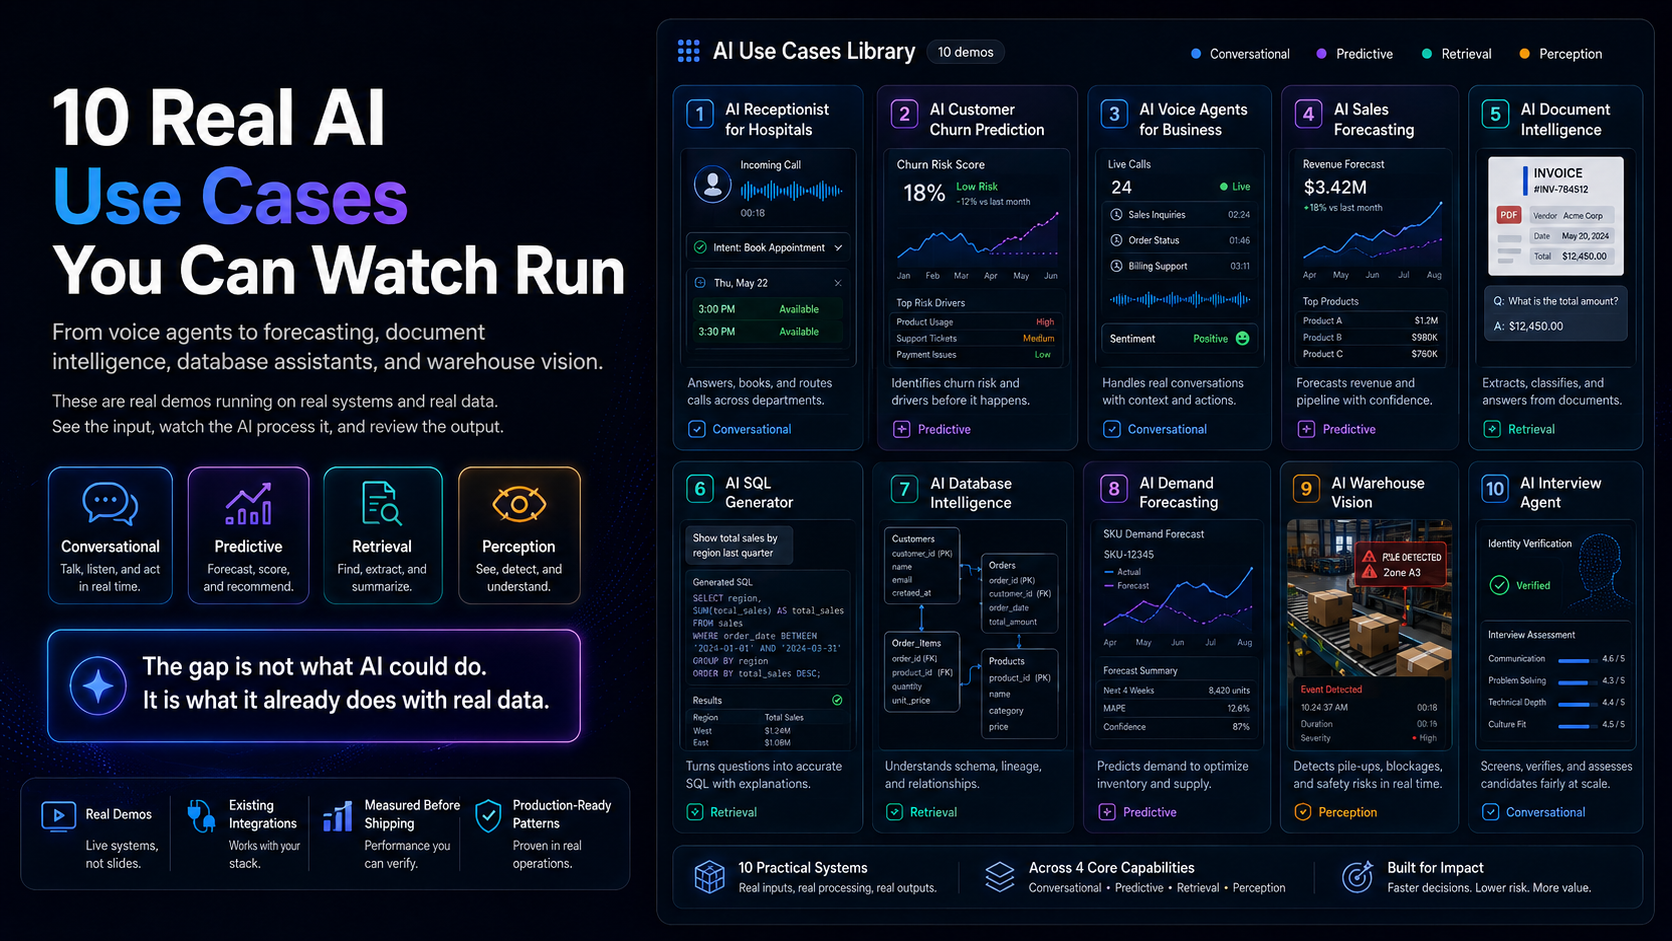
The demo shows demand forecasting at SKU level, with continuous re-forecasting against live signals, low-stock alerts raised before they become emergencies, and a view of working capital tied up in slow-moving stock.
Why the quarterly plan becomes fiction
The pattern is consistent across almost every mid-sized operation we have seen.
At the start of the quarter, someone builds a demand plan. It is careful work, based on last year’s numbers, known orders, and judgement about what is coming. By week three, a supplier lead time slips, a seasonal spike lands early, or a large order gets pulled forward. The spreadsheet cannot react without being rebuilt, so it quietly stops describing reality.
Everyone knows this. Nobody updates it, because rebuilding takes days and the next quarter’s plan is already due. The cost surfaces three months later as dead stock or a stockout, at which point it is attributed to unusual market conditions rather than to the planning cadence.
The problem is not the planner. It is that a manual plan updates at human speed while demand updates continuously.
What an AI demand forecast does differently
1. Forecasts at SKU level
Aggregate forecasts hide the errors that cost money. Total demand can be accurate while individual items are badly wrong in opposite directions. Since you order at SKU level, you need to forecast at SKU level.
2. Learns seasonality properly
Including the patterns nobody has articulated. Genuine demand cycles are frequently more complex than the obvious ones, with overlapping weekly, monthly, and annual effects, plus items that move together because customers buy them together.
3. Accounts for lead times
A forecast of demand is not an order recommendation until it accounts for how long each supplier actually takes, including their variability. An item with a reliable two-week lead time needs very different buffering from one with a lead time that ranges from three to nine weeks.
4. Incorporates external signals
Commodity prices, supplier reliability, promotions, and known upcoming events all shift demand. A model that only looks at past sales cannot anticipate a change that has not happened yet but is already knowable.
5. Re-forecasts continuously
This is the structural fix. New sales data, a changed lead time, or a large order arriving updates the projection immediately. The plan stays current because it maintains itself.
6. Recommends, with reasoning
The output that matters is not a demand curve, it is an order recommendation with an explanation. What to order, how much, when, and why.
What data you need
The minimum is two to three years of sales history at SKU level with dates and quantities, plus current stock levels and supplier lead times. Two years lets the model observe seasonality repeating.
Purchase order history, promotion calendars, and price change records improve accuracy meaningfully. But as with sales forecasting, the binding constraint is usually data hygiene: SKUs that were renamed mid-history, stock adjustments recorded as sales, and returns handled inconsistently do more damage than a shorter history.
Where demand models get it wrong
New products have no history. Genuinely new items cannot be forecast from their own past. Analogous product history helps, but expect wide uncertainty and say so rather than producing false precision.
Intermittent demand is hard. Items that sell irregularly, a few units every few months, are among the hardest cases in forecasting. Standard approaches perform poorly and specialised methods are needed.
Stockouts corrupt history. If an item was out of stock, recorded sales understate real demand. A model trained naively on that history learns to under-forecast, which causes more stockouts. Censored demand needs explicit handling, and it is frequently overlooked.
The forecast is not the decision. Optimal order quantity depends on holding cost, order cost, shelf life, and service level targets. A forecast feeds that decision; it does not replace it.
Structural change breaks it. Entering a new market or changing your customer mix means history is a weaker guide. The model will not tell you this. You have to.
What deployment looks like
Six to ten weeks, slightly longer than most because of the data preparation.
Weeks 1 to 2. Assemble sales history, stock levels, and lead times. Resolve SKU continuity issues. Agree the success metric, which is usually forecast error, stock turns, or working capital released rather than model accuracy in the abstract.
Week 3. Build the evaluation harness, testing against historical periods where the answer is known.
Weeks 4 to 7. Build the model, handle censored demand and intermittent items, and produce the order recommendation layer.
Weeks 8 to 10. Run in parallel with the existing planning process for a full cycle. Planners should see the model be right before being asked to rely on it.
How to judge whether it is worth it
Three numbers give you a defensible estimate: the value of stock currently classified as slow-moving or dead, the revenue lost to stockouts over the last year, and your current annual stock turns.
Dead stock plus lost sales is the size of the problem. A realistic improvement on that, against the cost of the system, is your answer. For most businesses carrying meaningful inventory, this is one of the clearer AI business cases, because the waste is measurable and the improvement shows up in working capital rather than in a soft metric.
Our framework for measuring AI ROI covers building that case properly.
Related use cases
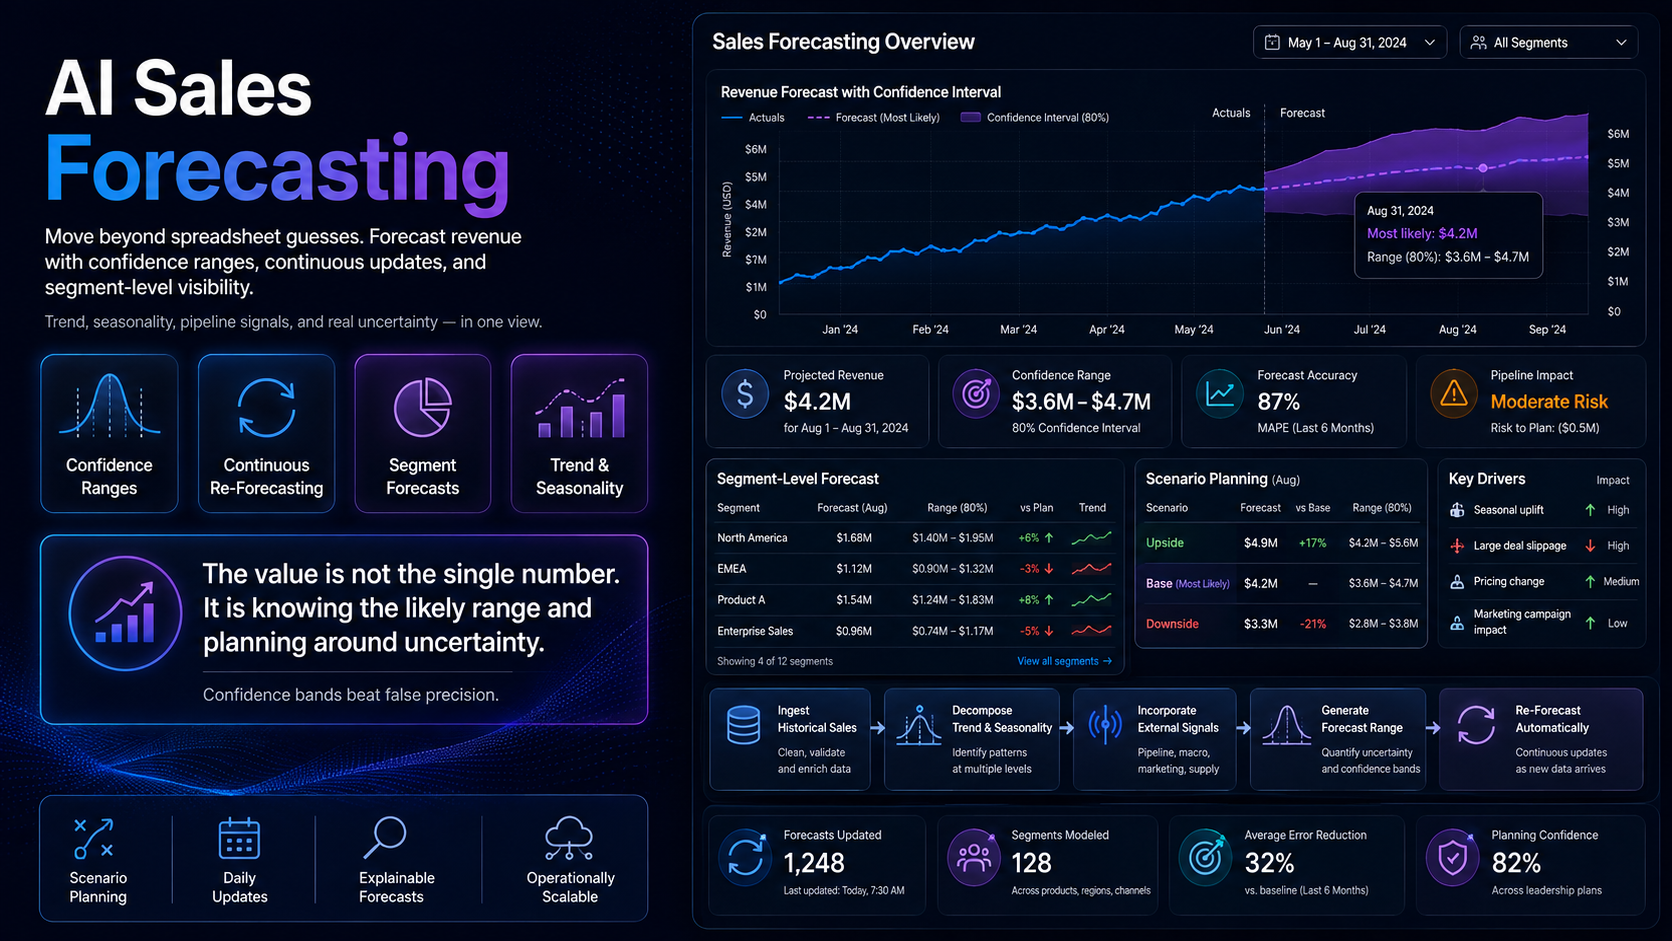
AI sales forecasting applies the same family of techniques to revenue. For warehouses, AI warehouse vision addresses the physical operation rather than the planning layer.
Browse everything in our AI use cases library.
Frequently asked questions
How much history do we need?
Two to three years at SKU level. Less than that makes seasonality hard to distinguish from noise.
How many SKUs can it handle?
Tens of thousands is routine. Large catalogues are usually easier than they sound, because items are grouped into families with shared patterns.
What about seasonal or fashion items with short lifecycles?
These are harder. Forecasting relies more on analogous history and early-season signal, and the uncertainty is genuinely wider. A good system reflects that rather than hiding it.
Does it integrate with our ERP?
It should. Recommendations belong in the system your planners already use. Integration with common ERP and inventory platforms is standard.
Will it replace our planners?
No, and it works best when it does not try to. It removes the rebuilding work so planners spend time on exceptions, supplier negotiation, and the judgement calls the model cannot make.
How do we handle promotions?
Promotions should be an explicit input. A model that does not know a promotion is coming will under-forecast it, and one that does not know a past spike was promotional will over-forecast the following period.
AINinza is the AI practice of Aeologic Technologies, backed by over a decade of enterprise engineering. If your demand plan is rebuilt by hand and stale by week three, we are happy to talk through what continuous forecasting would look like on your data.