AI Customer Churn Prediction: How It Works, With a Live Demo

Most companies find out about churn by reading a cancellation email. At that point the decision is already made, the customer has usually been unhappy for weeks, and the retention conversation you are about to have is the least effective version of that conversation.
AI customer churn prediction moves that moment earlier. Instead of reacting to cancellations, you get a ranked list of who is likely to leave in the next 30 to 60 days, while there is still time to do something useful about it.
This article covers how churn models actually work, what data you need, why explainability matters more than raw accuracy, and where these systems mislead you.
Watch the demo
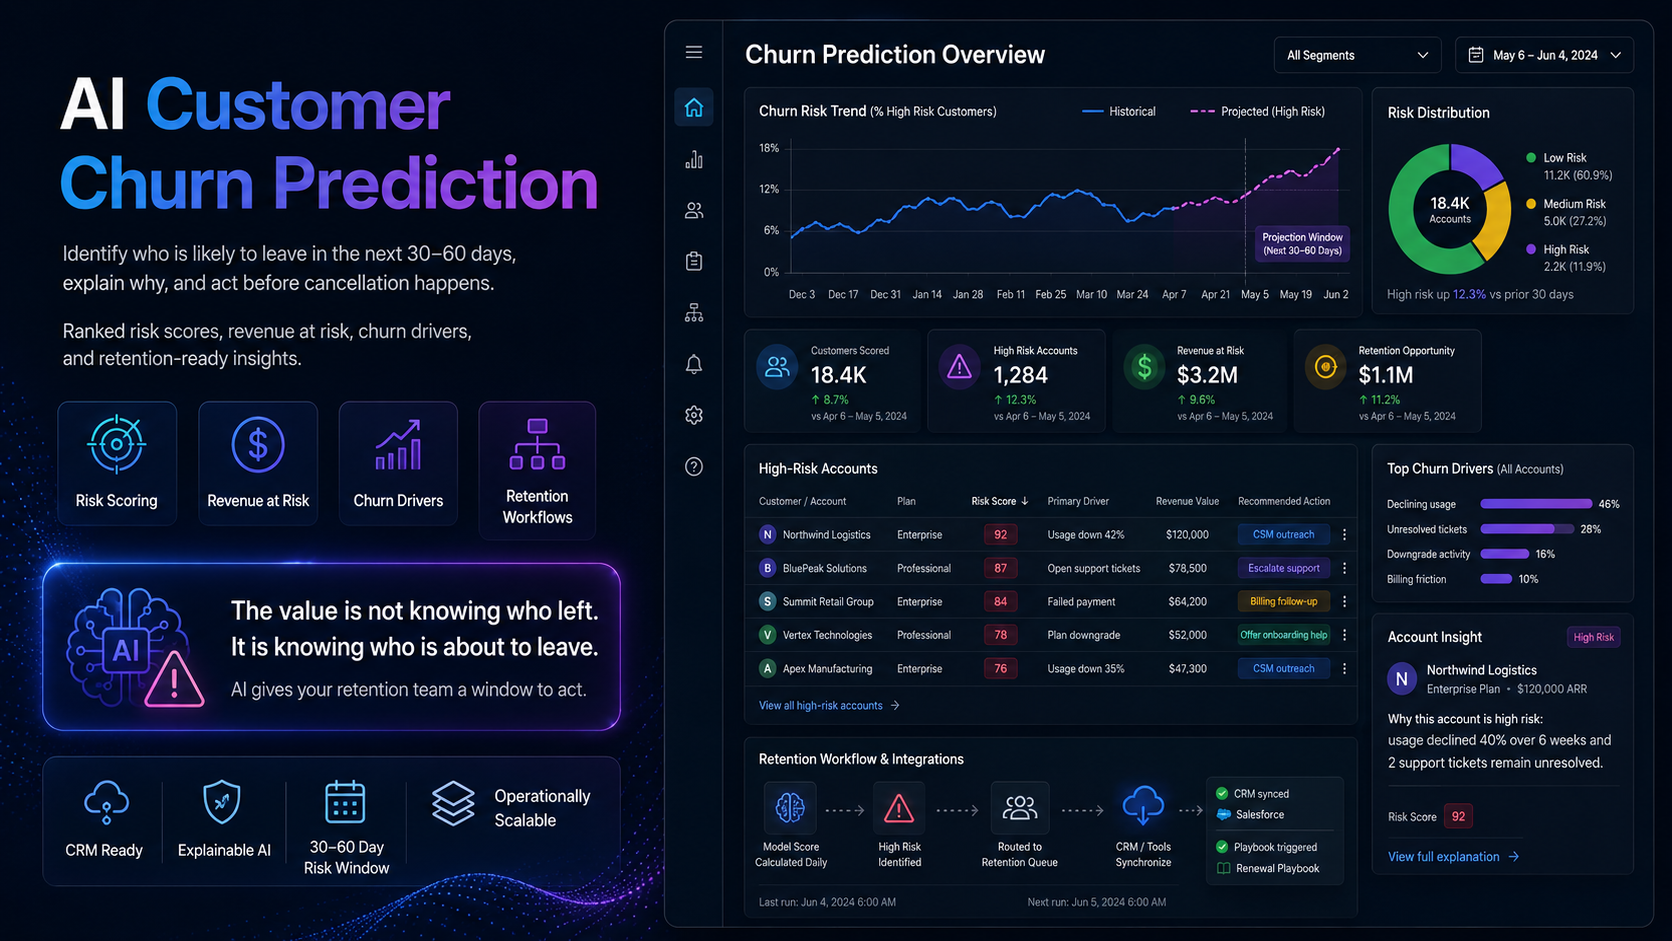
In the recording, a customer CSV is uploaded and the model scores each account for churn risk in the next 30 to 60 days. The dashboards break the base into risk segments, quantify the revenue at risk, surface the drivers behind churn across the population, and generate a written explanation for each individual score.
Why churn is worth predicting rather than just measuring
Nearly every subscription business tracks a churn rate. Far fewer can name which specific customers are about to leave, which is the only version of the metric you can act on.
The economics are straightforward. Retaining an existing customer is materially cheaper than acquiring a new one, and existing customers spend more over time. A retention save is therefore worth more than an equivalent new sale, but only if you reach the customer before they have emotionally decided to leave. After that point, discounting rarely works, because the discount addresses price when the actual problem was usually value, onboarding, or an unresolved support issue.
The window is the whole point. Prediction buys you the window.
How a churn model works
1. Assemble the signals
Churn models learn from historical customers whose outcome you already know. The signals that carry most of the weight are usually unglamorous.
- Tenure. How long they have been a customer, and where they sit relative to known drop-off points.
- Usage. Frequency, depth, and direction of travel. A declining trend is often more predictive than an absolute level.
- Billing. Monthly charge, plan changes, failed payments, and how their spend compares to similar accounts.
- Support history. Ticket volume, unresolved issues, sentiment, and time to resolution.
- Engagement. Logins, feature adoption, whether new users are still being added.
2. Learn the pattern
The model is trained on customers who churned and customers who did not, and it learns which combinations of signals preceded cancellation. The important nuance is that it learns combinations rather than single rules. Low usage alone might mean nothing. Low usage combined with a recent unresolved support ticket and a plan downgrade is a very different story.
3. Score the current base
Every active customer receives a probability. In practice, the number itself matters less than the ranking, because your retention team has finite hours and needs to know who to call first.
4. Explain the score
This is where most implementations fall down. A score with no reasoning is unusable, because the person making the retention call needs to know what to actually say. A good system tells you that this account is at risk primarily because usage dropped 40 percent over six weeks and two support tickets went unresolved, which is an actionable brief. A bare risk score is not.
5. Route it into a workflow
The output has to arrive where the work happens. That means the CRM, a dashboard the success team already opens, or an alert that triggers a play. A model whose output lives in a notebook changes nothing.
What data you need to start
The practical minimum is a customer table with one row per customer, including at least 12 months of history and a clear record of who cancelled and when. Without labelled outcomes, there is nothing to learn from.
Beyond that, more signal helps but is not required to begin. Many usable models are built on tenure, billing, usage, and support data alone, which most businesses already have in their billing system and helpdesk.
The most common blocker is not data volume. It is that churn is recorded inconsistently, or that cancellations and downgrades are conflated, or that the date recorded is when the subscription lapsed rather than when the customer decided to leave. That definitional work has to happen before modelling, and it usually takes longer than expected.
Where churn models mislead you
Accuracy is a misleading headline. If 5 percent of your customers churn, a model that predicts nobody churns is 95 percent accurate and completely useless. Look at how well it ranks the customers who actually left, not at overall accuracy.
Correlation gets mistaken for cause. A model might learn that customers who contact support churn more. Acting on that by discouraging support contact would be catastrophic. The model finds patterns, not mechanisms. Human judgement supplies the mechanism.
Intervention changes the outcome you are measuring. Once you start acting on predictions, the customers you save stop appearing as churners, which makes the model look wrong. This is success, but it complicates evaluation. Hold out a control group if you want to measure genuine lift.
Models drift. Customer behaviour changes when you change pricing, ship a major release, or enter a new segment. A model trained on last year’s behaviour degrades quietly. Plan for periodic retraining rather than treating it as a one-off build.
Saving everyone is not the goal. Some churn is healthy. Customers who were a poor fit, bought for the wrong reason, or cost more to serve than they pay are not worth retaining. Prediction should feed a judgement about who is worth saving, not a blanket rescue campaign.
What deployment looks like
Four to eight weeks is typical.
Weeks 1 to 2. Define churn precisely, assemble historical data, and confirm outcomes are labelled reliably. Agree the success metric, which is usually retention lift in the targeted segment rather than model accuracy.
Week 3. Build the evaluation set before building the model, so there is an objective standard to hit.
Weeks 4 to 6. Train, tune, and build the explanation layer and dashboards.
Weeks 7 to 8. Pilot with the retention team against a control group, and measure whether the interventions actually change outcomes.
That last step is the one most often skipped, and it is the only one that proves the project worked.
How to know if this is worth it
Three numbers give you the answer. Your annual churn rate, your average customer lifetime value, and the size of your customer base. Multiply them to get annual revenue lost to churn. Then ask what a realistic reduction looks like. Even a modest improvement on a large base usually justifies the work, but if your base is small or your churn is already low, the honest answer may be that better onboarding would return more than better prediction.
For a fuller treatment of that calculation, see our practical framework for measuring AI ROI. If you are deciding whether to build this internally or bring in help, the build vs buy TCO framework covers the tradeoffs honestly.
Related use cases
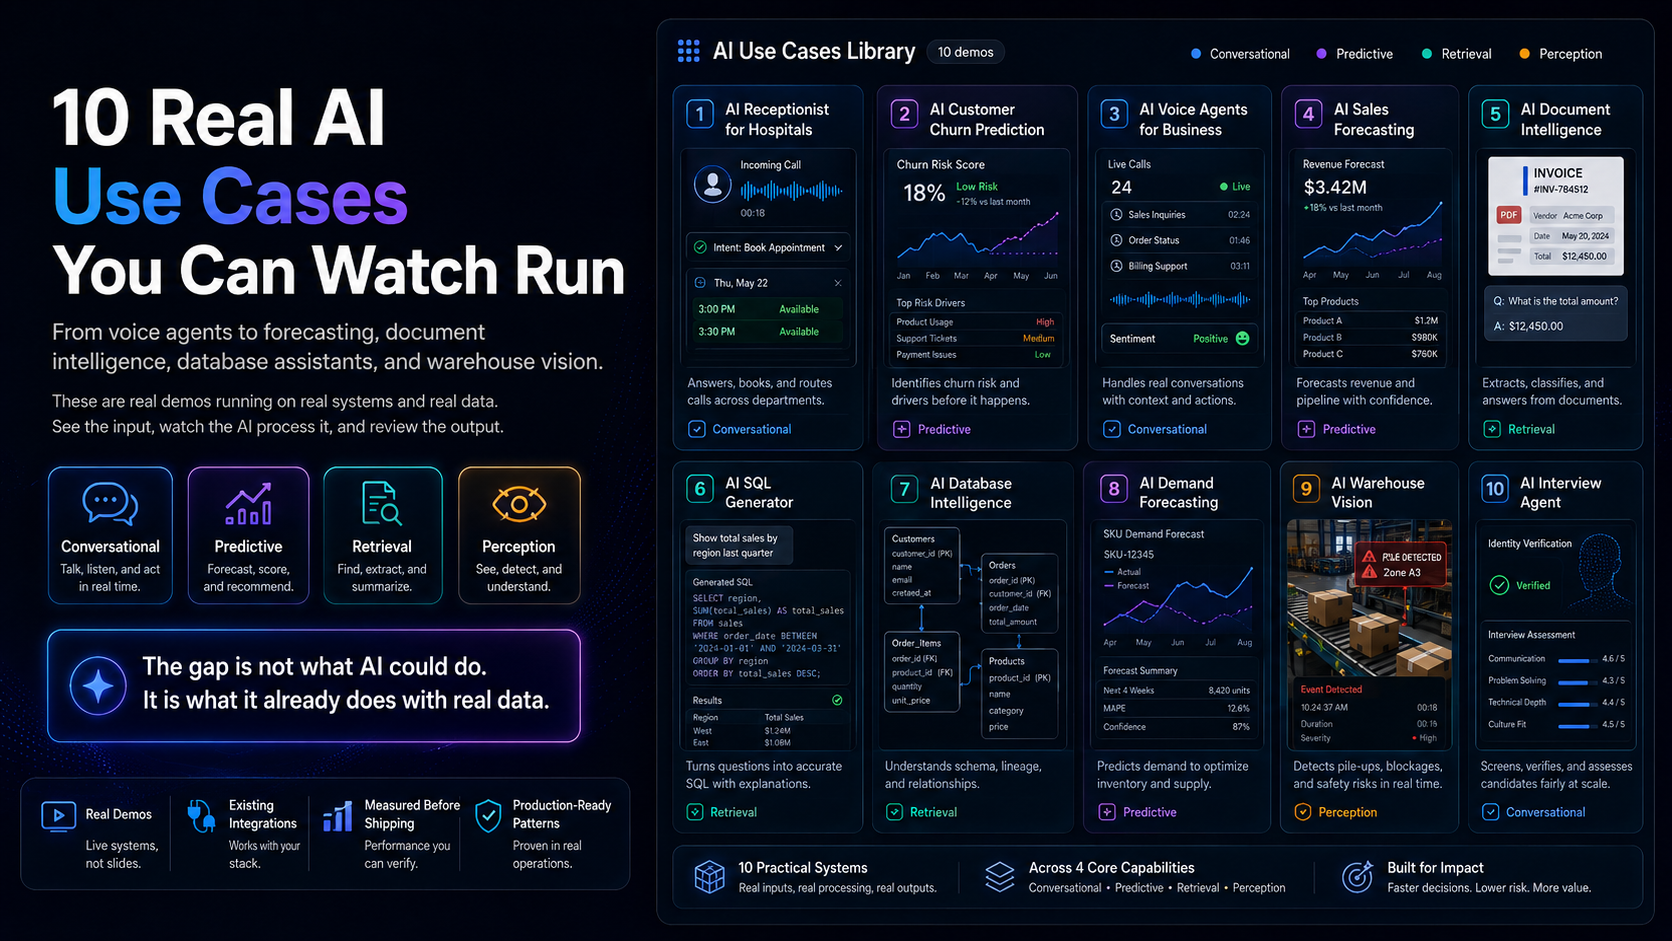
Churn prediction sits in the same family as AI sales forecasting, which applies similar techniques to revenue rather than retention, and AI demand forecasting, which does it for inventory.
Browse everything in our AI use cases library.
Frequently asked questions
How much historical data do we need?
At least 12 months, with enough churn events to learn from. A few hundred churned customers is a reasonable working minimum. Below that, the model struggles to distinguish signal from noise.
How accurate can churn prediction be?
It depends entirely on your business and how much of churn is driven by observable behaviour. Some churn is genuinely unpredictable, such as a customer’s own business closing. Judge a model by how well it ranks risk, not by an accuracy percentage.
Does this work for B2B as well as B2C?
Yes, though B2B usually has fewer customers and more signal per customer, including relationship and account-team data. B2C compensates with volume. The modelling approach differs in emphasis rather than in kind.
How often should the model be retrained?
Quarterly is a reasonable default for most businesses, sooner after any significant change to pricing, product, or target market.
What do we do with a high-risk score?
That depends on the reason behind it, which is why the explanation layer matters. A usage-decline risk needs a different intervention from a billing-friction risk. Blanket discounting is the most common and least effective response.
Can it predict when someone will churn, not just whether?
Broadly, yes. Most implementations score risk within a defined window, such as 30 or 60 days, which is more useful operationally than an open-ended probability.
AINinza is the AI practice of Aeologic Technologies, backed by over a decade of enterprise engineering. If churn is a number you track but cannot act on, we are happy to talk through what a prediction model would need from your data.